
Momentary pictorial composition
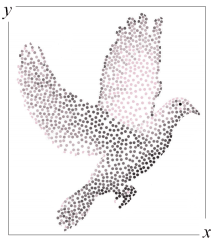
Figure 1. A dove in flight
We can identify any given position p on the 2D plane of a picture by specifying its x, y coordinates. The number of positions depends upon how many unit intervals one chooses to mark along the x and y axes. Mathematically, the number is limitless. Practically, the number is given by the smallest observable mark we use, such as a dot or pixel.
Accordingly, we can put marks at any of these positions to form a picture such as Figure 1, which represents a bird in flight (motion). Any position at which a mark is not placed must then be read as an “empty” one at which nothing observable can be illustrated. People might argue that since the pictorial bird is not actually moving, pictures are incapable of illustrating notions such as change and time. But that would be a visually illiterate understanding of how pictures are made and read.
Although the “momentary” compositional method of Figure 1 fixes one bird at one moment, and cannot show how this flying bird is at earlier and later moments, this compositional method is only one of two possible. Illustrators and photographers also use another method of composition, which we will call serial.
Serial pictorial composition
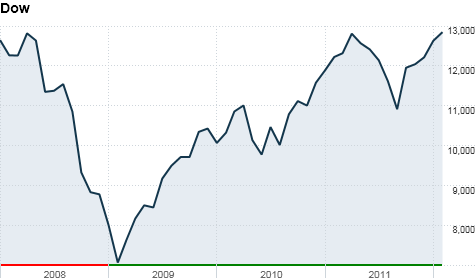
Figure 2. Serial composition showing share prices over time
Familiar pictures such as Figure 2 use serial composition to illustrate the change in some object, such as a share price p, over time. Unlike the dove in Figure 1, p is redrawn at a linear succession of places across the picture plane, where x and y are substituted by time and price height in order to define the p coordinates in the picture.
Unlike Figure 1, Figure 2 has to be read like a text, starting from an origin at the left margin and following the p line across the picture to the right margin. There is no such origin or reading direction in Figure 1 which, like a place map or a landscape painting, can be read from any origin in any direction.
Block-theorists would argue that Figure 2 is just one part of a much bigger picture that includes all the pre-2008 and post-2011 prices. According to them, we should consider all the prices in Figure 2 as co-existent with earlier and later ones, which means that our notion of prices changing over time is one that merely reflects our growing awareness of prices that are “already there”, even though we can’t now see that far.
But there’s no denying that the share price at the end of 2008 was different to that at its beginning. This shows that there is a true distinction between a price at a single date and a price that extends over a sequence of dates. The word that indicates this indisputable difference is change, as in “the Dow index price changed over 2008”.
The need for visual literacy is further demonstrated by Figure 3, which is taken from a physics text book explaining the measured properties of electromagnetic waveforms in terms of the geometric relationship between the functions of the circle, π and sin(θ).

Figure 3. Serial composition showing the sine wave as a function of time.
The circle to the left can be read like any other geometric construct as a changeless whole. But the sine wave to the right is a serial composition, as is indicated by its change of horizontal axis label from x (space) to t (time). If we imagine the radius OP to be continuously rotating like the second hand of a watch (but counter-clockwise) then the sine wave plots the y height of P relative to the horizontal for each successive degree of rotation.
If we view the sine curve as a changeless “standing” wave found by marking regular steps around the circumference of a circle, then that poses the question of why physicists change its x axis label to t. The reason is that the distance d separating a pair of relatively stationary objects can be defined by x, y, z coordinates. But if the objects are relatively separating, then we need an extra clock coordinate, t, to distinguish d from the r = distance travelled measure of the how far the objects have separated over a period t.
Hence, no student of physics can progress by reading the sine wave in Figure 3 simply as a standing wave. It plots a series of events which do not appear all together in the view of any separated observer. All that one observer sees at one moment is the position of P on the circle. That’s like seeing a clock hand at one position on its face. We can’t do physics with clocks that have their hands fixed at one position!
Serial compositions such as Figures 2 and 3 map an object with a single identity at a succession of different places. One object at a series of places defines a series of events. Hence, serial compositions are event maps, and their construction method is different to that used for making place maps. Newly built roads can be plotted into a place map without altering its width. But a next price point cannot be plotted into a stock market graph without widening it. Block universe theorists appear blind to this essential distinction between the fixed form of a place map and the dynamic form of an event map.
Objects and events
Like a photographic snapshot, a physical event appears as a composition of forms. We call the components of this composition “objects” and categorise each of them in terms of their generic properties such as shape, colour, mass and temperature, much as we classify individuals in a crowd in terms of their age, sex, occupation, etc.
This composition of forms invites us to redefine a physical event as one in a cumulative series of detected object juxtapositions. We call this series “observer’s time”. Detection is an interaction between an observer and separated objects (including the signals they emit). Separated observers detect different features of the same object (e.g. its back and front) and the composition of a collection of objects may differ in successive detections.
Yet from definition, the existence of a “physical” object does not depend upon someone detecting it. A physical object doesn’t need observers, but a physical event does, because it is an interaction between objects and observers. Since a vast Universe may contain all manner of objects that await discovery by numerous observers, a physical object can exist without “occurring” as an event detected by any observer! But reflexively, observers may reasonably doubt the physical existence of objects that are undetectable.
A physical universe must then comprise of component objects rather than events. The distribution of objects in a space determines the sequence in which a given observer will detect physical events. For example, someone tells me that there is now a letter in the post that I will receive tomorrow. For me, that letter is what I presently believe to be a distant object. It might presently be included in events witnessed by postal workers, but I can’t include it in my own list of events until I receive it.
An observer’s discovery of a certain composition of objects at a certain moment in a sequence of clock readings is a unique interaction that does not recur. Yet individual objects can recur in the successive events recorded by their observers, and in different shapes and states. If a collection of objects and observers can appear differently composed in successive events, then its composition changes over that series.
This explains why any attempt to graphically map a sequence of changing object compositions requires us to redraw each individual object at a succession of places across the picture plane. The composition of any picture that shows one identity more than once is dynamic and not static. Adding one to a list of events necessarily lengthens the list.
